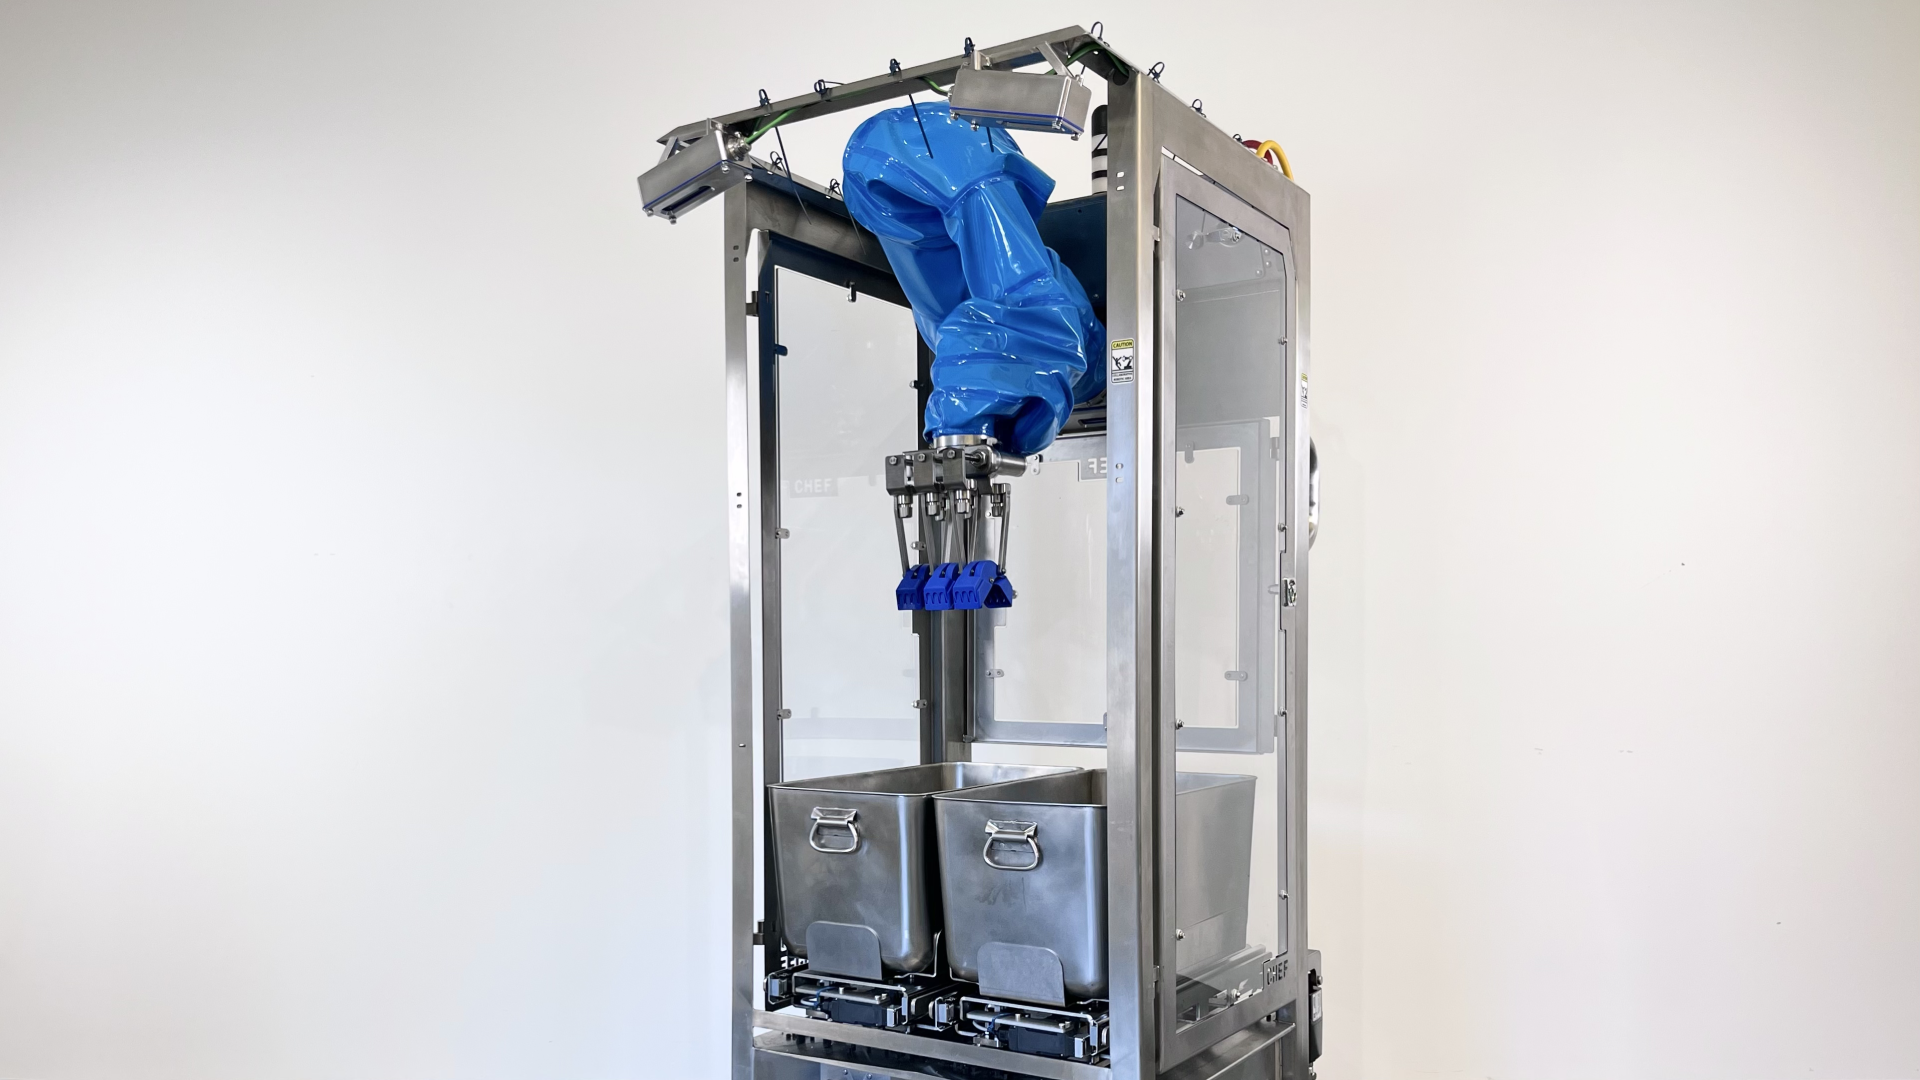
Chef robots have made over 130M servings in production. Every serving logged a robot action applied to real food, with the outcome measured on a scale. We are now using this data to train a Food World Model (FWM), a learned model of how food behaves when a robot picks it. This blog describes an initial run of the FWM. Our model outperforms baseline production data on eight of nine food ingredients, cuts post-pick surface errors by 42%, and includes an interactive visualizer for readers to explore.
How our Food World Model (FWM) works
Given the current state of a pan of food and a candidate action, our FWM predicts the consequence of that action before the robot takes it. Specifically, it predicts two things: the pick weight (i.e., how much of an ingredient our robot will pick) and the resulting food topology (i.e., what surface will be left behind in the ingredient pan).
Formally, it predicts the joint distribution over post-pick topology and picked weight:
p(s′, w | s, a)
where s is the 2.5D heightmap of the pan, a is the pick action, w is the picked weight, and s′ is the post-pick topology.
We predict both because together they let us model how a sequence of robot actions affects the food. Pick weight tells us the immediate outcome of an action: whether a given pick will hit the customer’s target weight. Post-pick topology tells us how that action changes the food’s state for the next pick. The output of one prediction can therefore become the input to the next, allowing us to simulate not just individual picks but how the food evolves over a sequence of picks.
Getting the pick weight and food topology right pays off in two places. The first benefit is portioning and consistency. A customer’s specification is a band around the target weight (e.g., ±5-10%), and not every pick lands inside it. A high spread (i.e., standard deviation) puts a pick outside the band. Predicting a pick’s outcome before it happens (i.e., forward simulation) lets us narrow that spread. We can take the outcome of each candidate action, then choose a per-pan state instead of applying one recipe to every state. Among equal-mean actions, we choose the one with the lowest predicted spread. In other words, we can simulate thousands of possible actions with different parameters and then execute the action with the lowest standard deviation.
The second benefit is new ingredient onboarding. Teaching Chef robots to handle a new ingredient can be cumbersome, as every ingredient is different. With our FWM, a new ingredient becomes finding an embedding and optimizing over tools and parameters inside the world model.
We trained a neural simulator on a subset of the full dataset as a starting point. The visualizer below shows the actual pan topology before a pick, the pan topology our model predicts, and the actual pan topology after the pick.
Three panels of one held-out pick. Left: the pan before the pick obtained from RGBD camera measurement. The cyan arrow indicates the pick position (action). Top right: the pan the simulator predicts. Bottom right: the pan the camera measures after the pick.
Why building an FWM is challenging
Rigid-body physics engines assume predictable dynamics. For food ingredients like shredded chicken, cooked rice, or mac and cheese, this assumption does not hold. Food is granular, deformable, cohesive, viscous, and temperature-dependent. Its characteristics change from one batch to another and even when scooping the same ingredient from the top vs. the bottom of a pan. As food ingredients are difficult to model correctly, our robots learn how to manipulate them using real-world data instead.
The approach of learning food manipulation from data raises two questions: what to predict, and how to label it. As mentioned, we predict the pick weight and the resulting food topology. The topology label originates from the predicted camera depth map. The pick weight is harder to label because we can’t observe it with camera data. It needs to be measured with a purpose-built scale rather than annotated.
In real-world customer deployments, Chef robots weigh every portion, so each pick logs its own outcome. The labels are measurements rather than annotations, which is ideal for our self-supervised learning and data flywheel setup. Our training dataset grows at the same rate as our robot production data, without any additional labeling cost.
Results
In our initial run of the FWM, we evaluate both weight and topology against ground truth (i.e., weight and topology measurements) obtained from production data. For weight, our error metric is the root mean squared error (RMSE) between measured and predicted weight, and our baseline is the mean estimator (i.e., the average of all measured picked weights for that configuration). For topology, our error metric is the RMSE between the measured post-pick surface and the predicted post-pick surface. Our baseline assumes the pick does not change the food surface at all.
Quantitative results
1. Weight
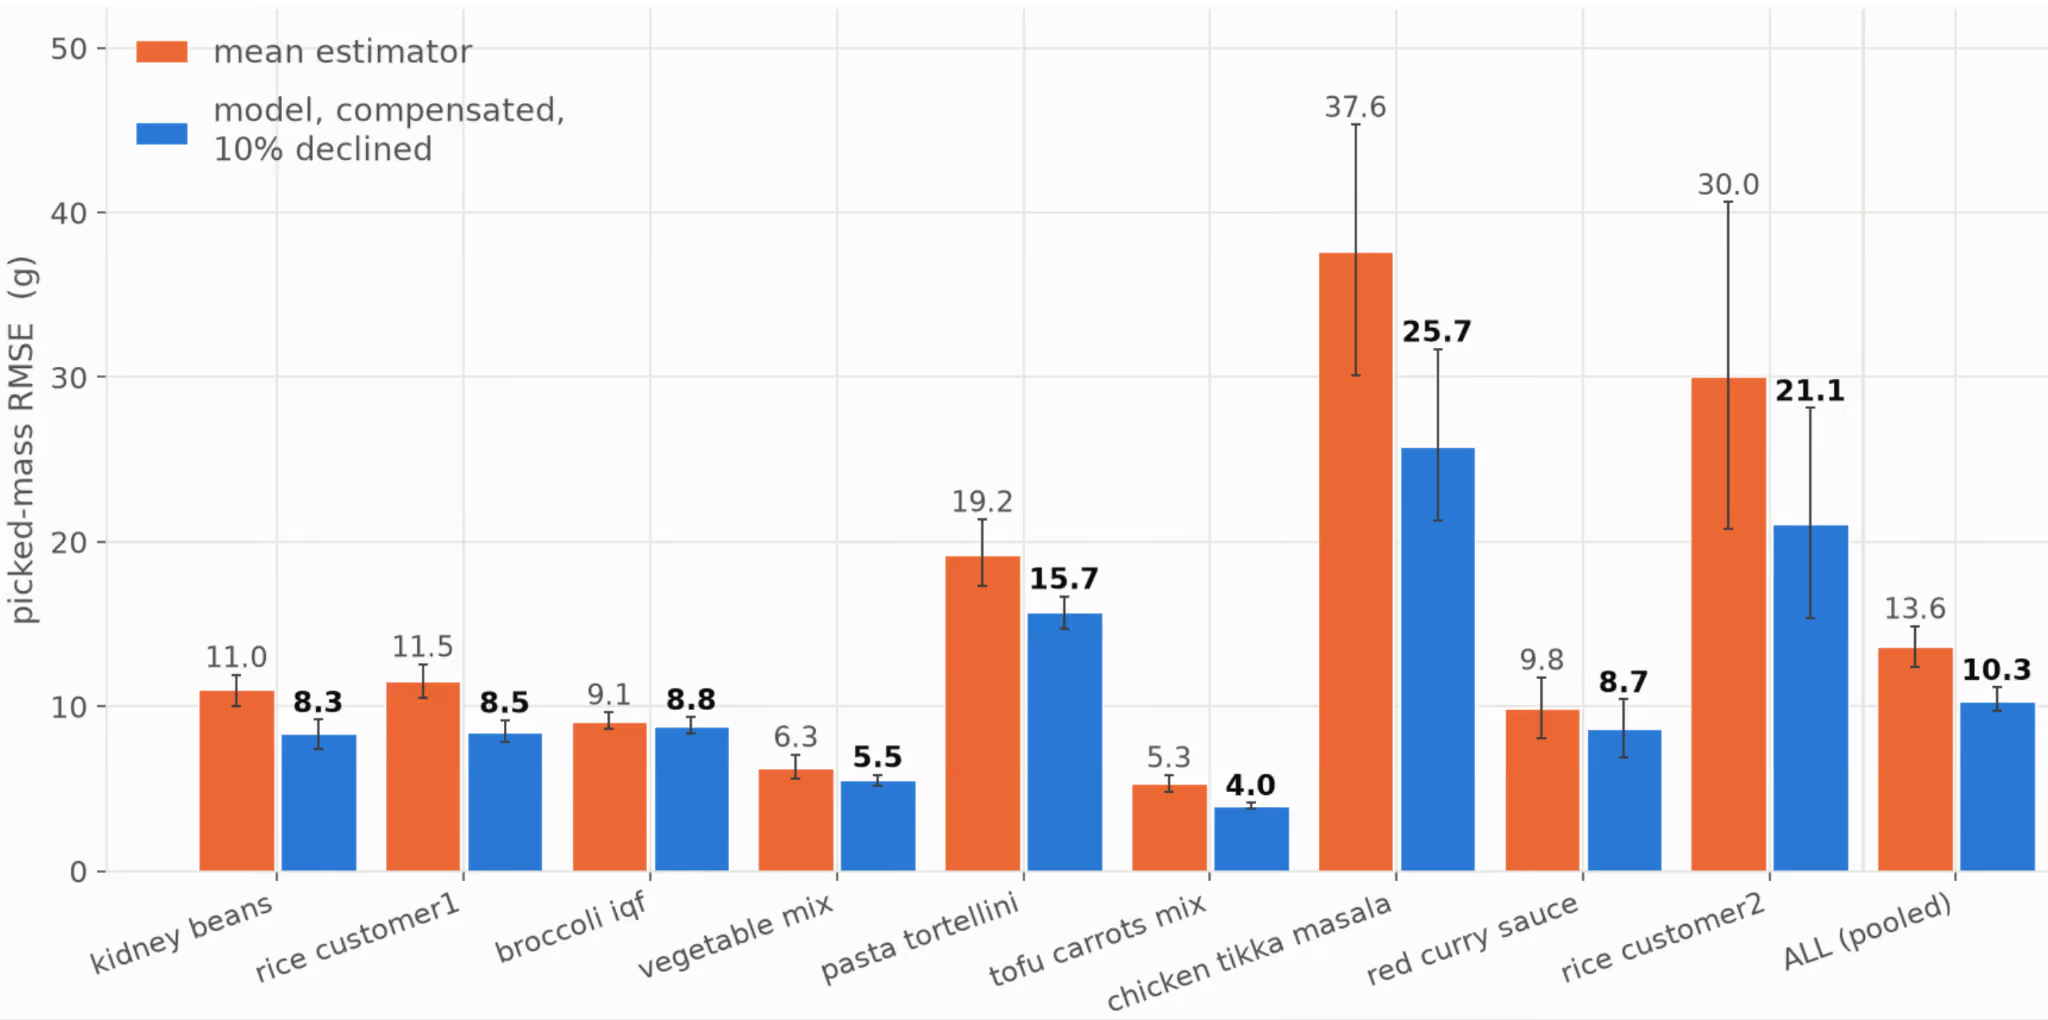
The orange bars indicate the RMSE of the mean estimator. The blue bars indicate our model’s prediction over a held-out test set. Our FWM (blue) improves the RMSE from 13.6 g to 10.3 g overall and beats the mean estimator on all nine ingredients.
2. Topology
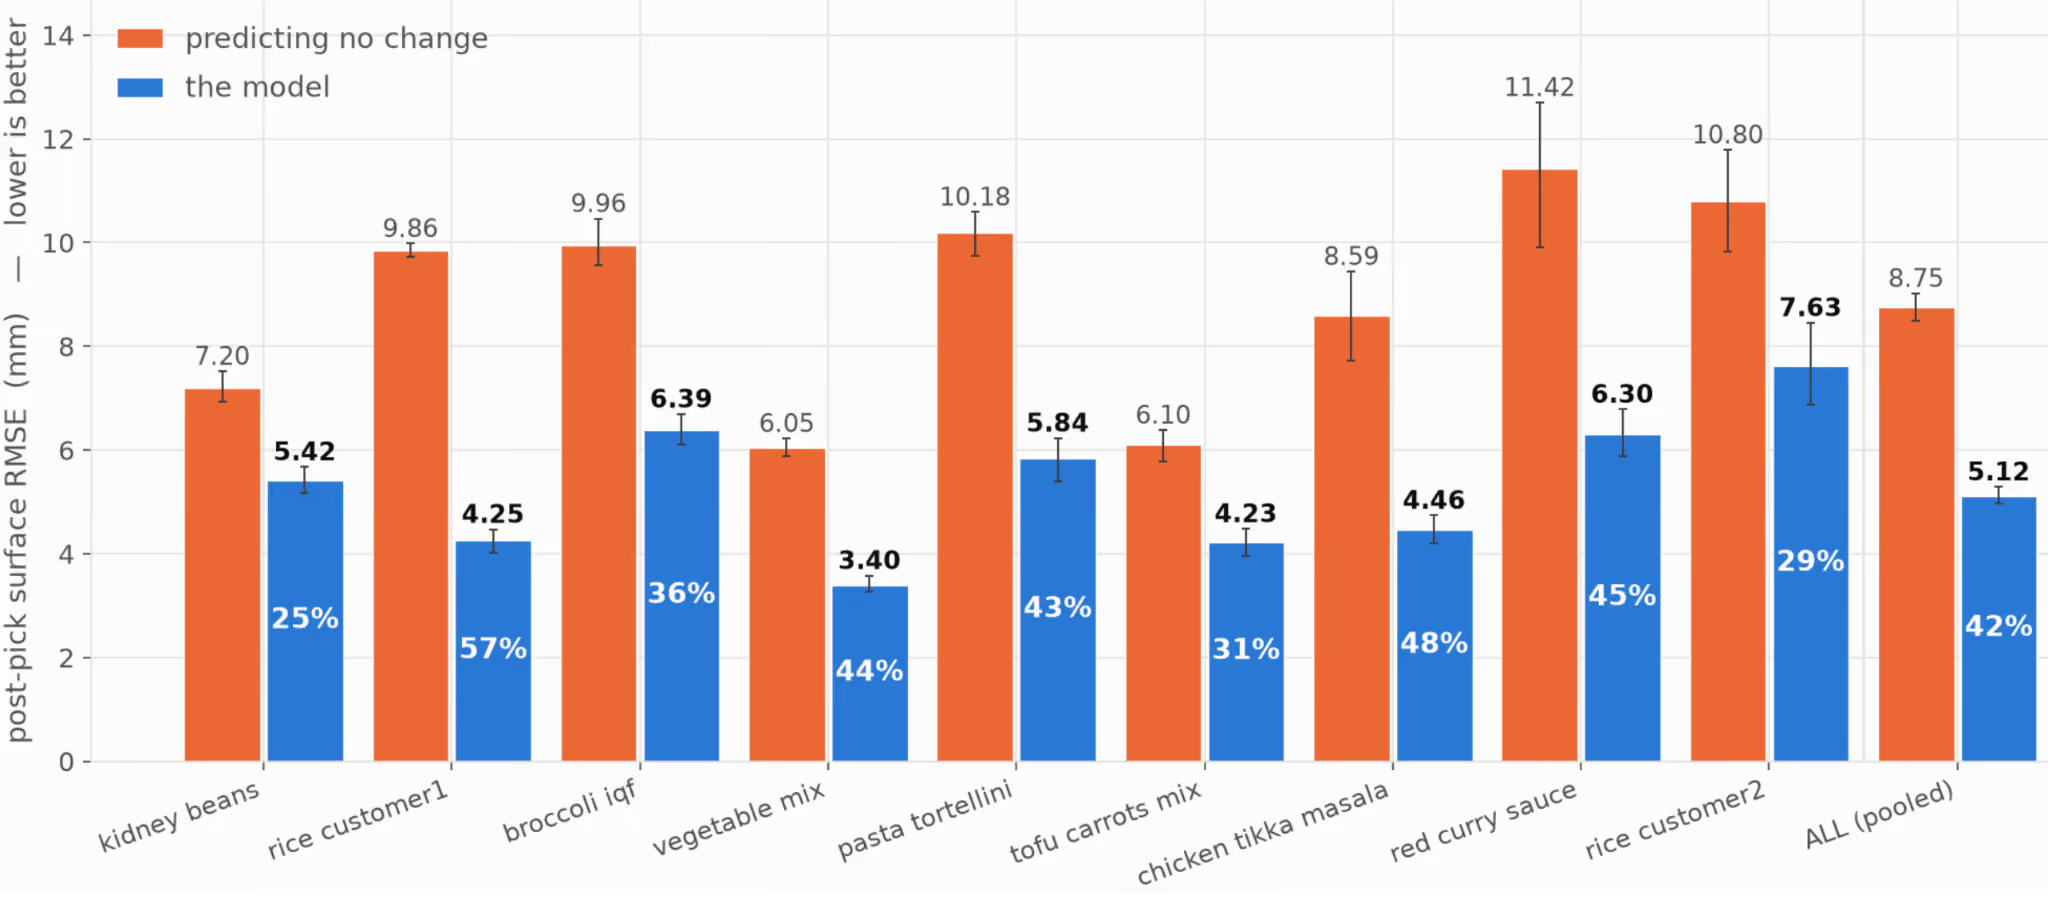
The orange bars indicate the RMSE between the measured post-pick and the measured pre-pick surface. The blue bars indicate the RMSE between the measured post-pick and our surface prediction. We can see that our model can predict the next surface well overall (5.09 mm vs. 8.75 mm). Our FWM reduces post-pick surface errors by 42% and performs better on all nine ingredients.
Qualitative results
1. Weight
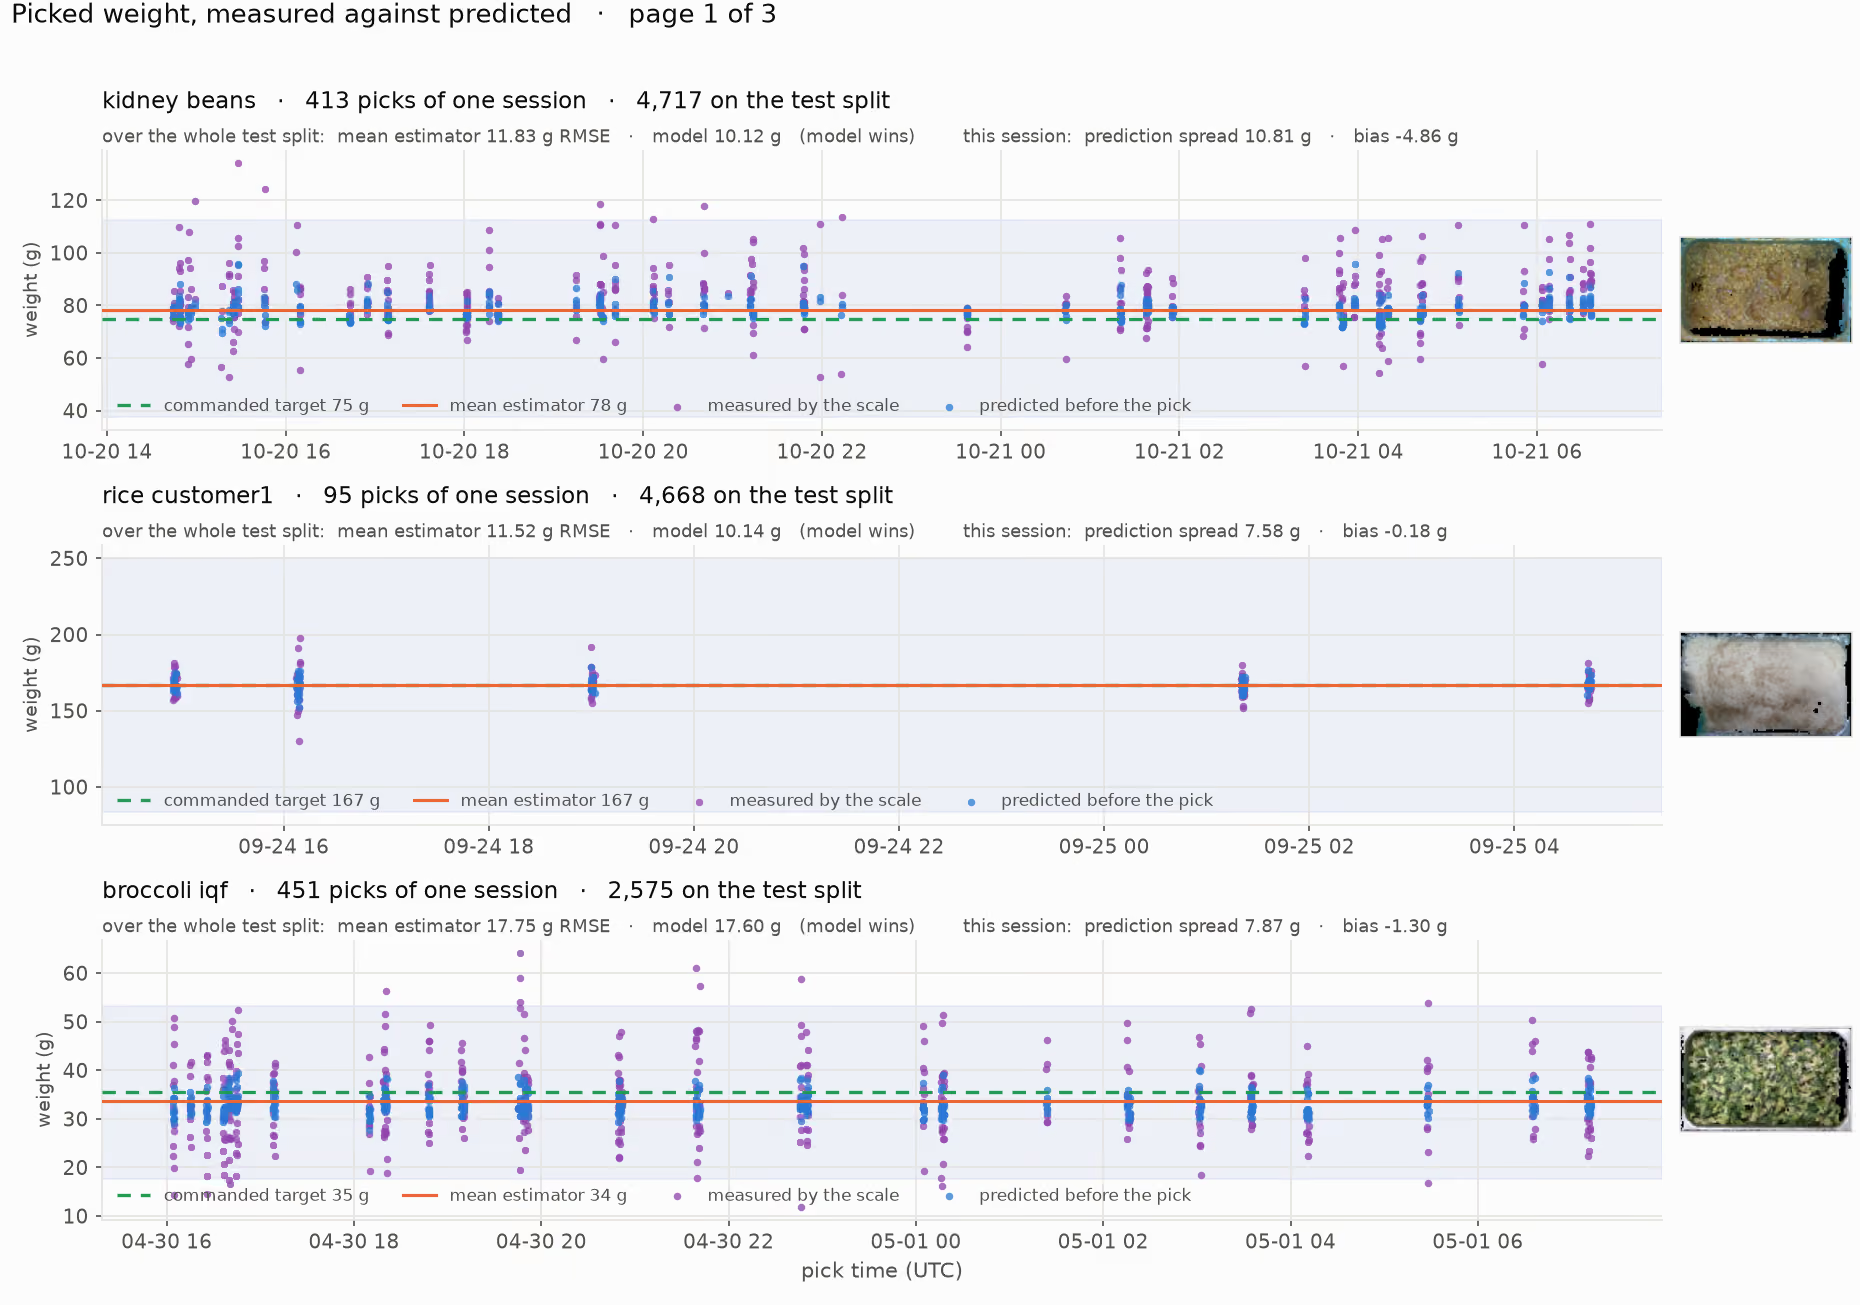
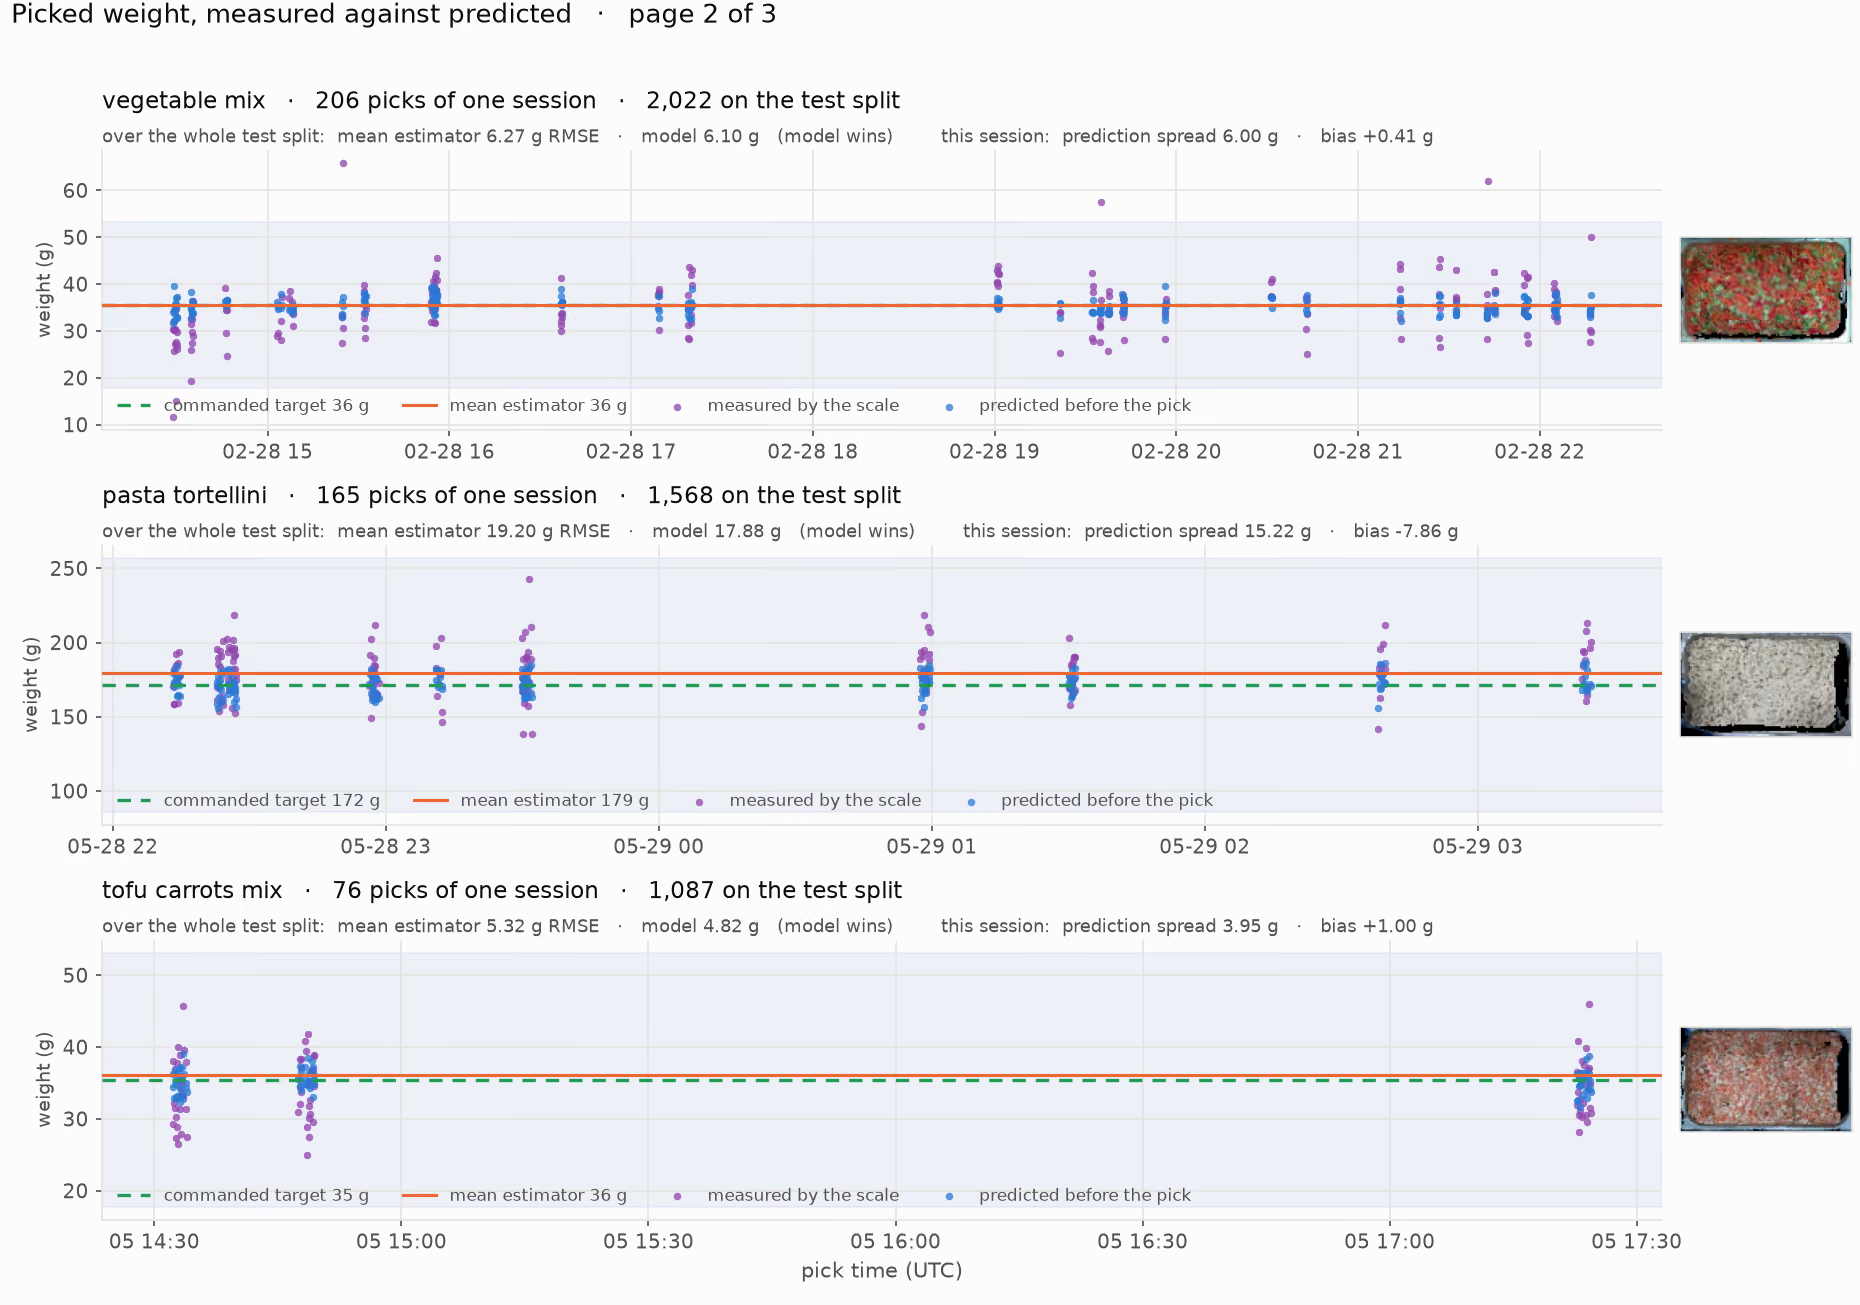
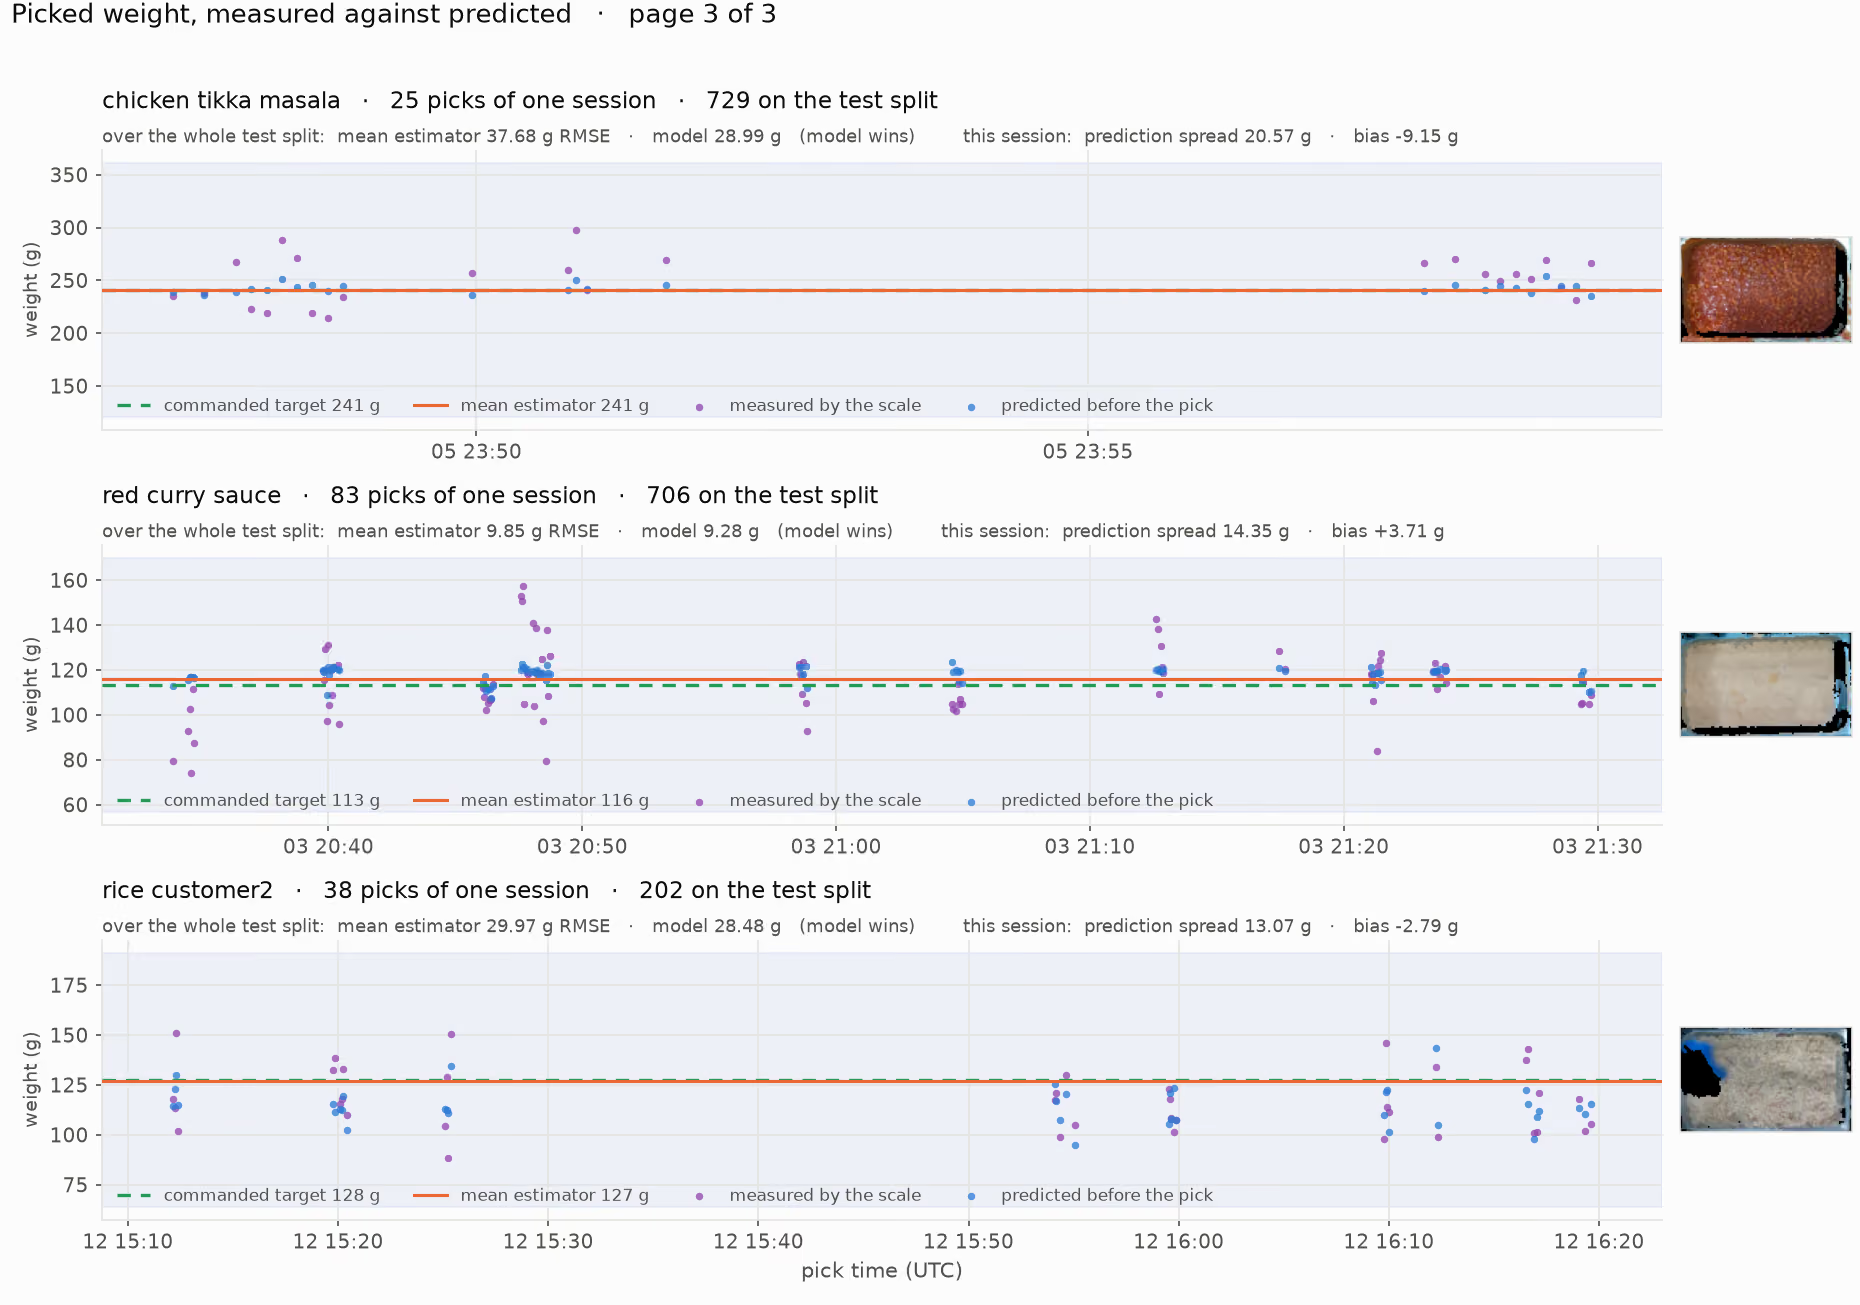
We plot weight measurements (purple) and predicted weight (blue). With our FWM, the prediction moves with the measurement, rather than sitting on the single constant that the mean estimator gives.
2. Topology
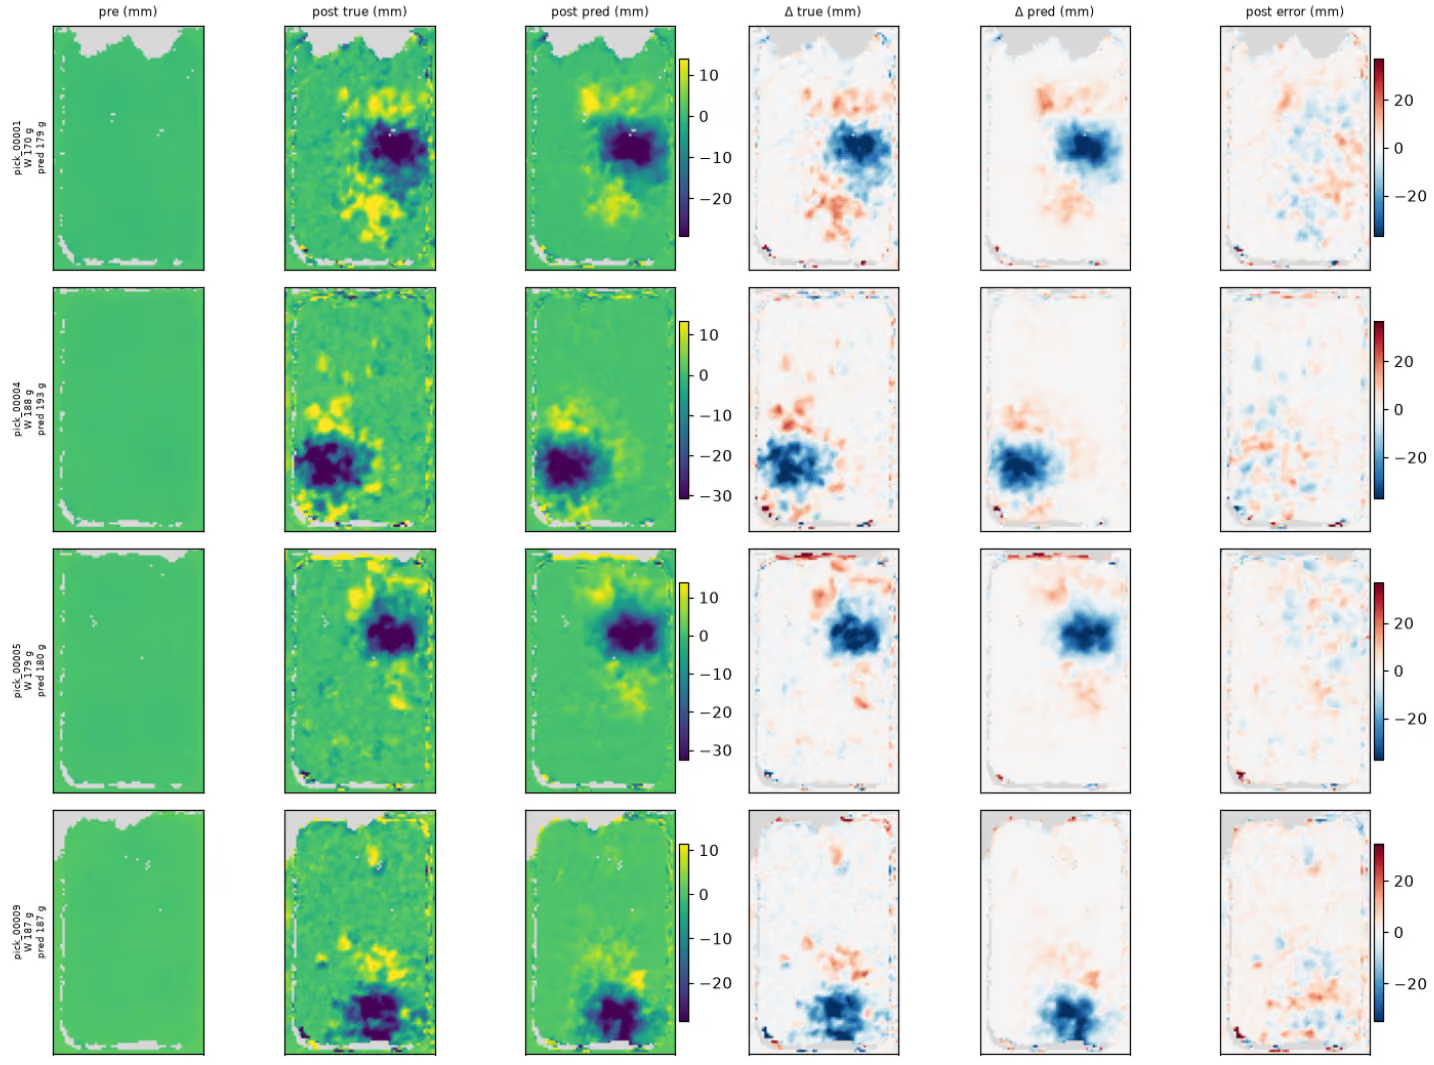
We compare our food topology prediction against the measured topology of four picks in a 2D height map. The first column shows the measured pre-pick topology. The second shows the measured post-pick topology. The third column is our prediction. It is slightly blurred and misses the auxiliary effects caused by the picking operation, but it qualitatively predicts the topology well. The fourth and fifth columns show the measured and the predicted change. The last column shows the error.
What’s next?
With the initial run of our FWM, we have shown a forward model of food dynamics. Given a particular food ingredient and a candidate pick, our neural simulator predicts the picked weight and the surface topology the pick leaves behind. Next up, we will continue working through the following challenges:
- Scale: We will train our FWM on the full dataset of 130M servings across all ingredients and production sites, allowing us to measure how well the model generalizes to new ingredients rather than assume it does.
- Pick depth estimation: Once we can predict the outcome of a pick, we can turn the problem around and determine which pick depth will land closest to the target weight.
- Closing the loop: From there, our robots will be able to evaluate candidate actions against the FWM before they move and execute the one predicted to produce the best outcome.